from logistic_regression import LogisticRegression # your source code
from sklearn.datasets import make_blobs
from matplotlib import pyplot as plt
import numpy as np
np.seterr(all='ignore')
%load_ext autoreload
%autoreload 2
# make the data
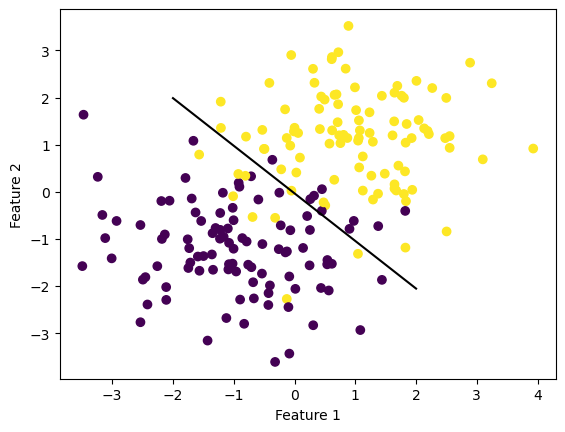
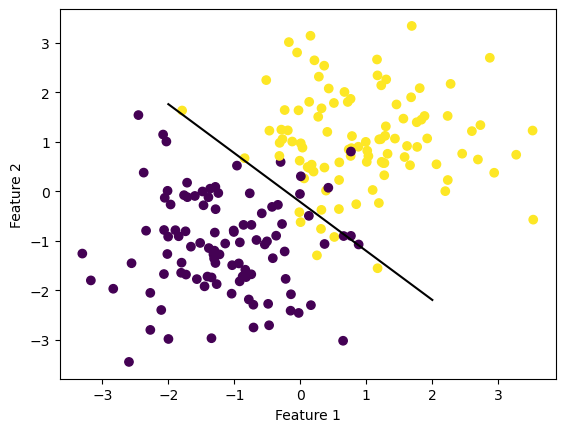
p_features = 3
X, y = make_blobs(n_samples = 200, n_features = p_features - 1, centers = [(-1, -1), (1, 1)])
fig = plt.scatter(X[:,0], X[:,1], c = y)
xlab = plt.xlabel("Feature 1")
ylab = plt.ylabel("Feature 2")
#create instance of LogisticRegression Class and fit data
LR = LogisticRegression()
LR.fit(X, y, alpha=.001)
def draw_line(w, x_min, x_max):
x = np.linspace(x_min, x_max, 101)
y = -(w[0]*x + w[2])/w[1]
plt.plot(x, y, color = "black")
#plot line using calculated weights
fig = draw_line(LR.w, -2, 2)The autoreload extension is already loaded. To reload it, use:
%reload_ext autoreload